Find a line of best fit and predict a value
Enter paired data to find the linear regression equation and correlation coefficient, then estimate y for a new x.
This article is not available in your language yet, so the English version is shown.
Given a set of paired values, you need a straight-line equation and a prediction for a new . For this example, enter these five pairs:
Find the linear regression line , then estimate when .
Enter the pairs, fit the line, and predict y
Below each step is the screen you should see after pressing.
Next to each step is the screen you should see after pressing.
-
Step 1
Open the mode menu and tap Statistics, then choose . The table has an column and a column. Start with an empty table; see below if old data is still there.Press: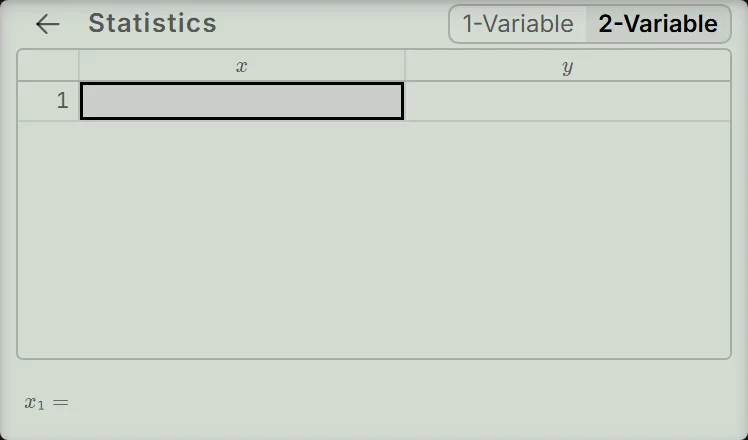
-
Step 2
In the first cell, enter , pressing the equals key after each value. The cursor moves down the column; the cells stay empty until you fill them.Press: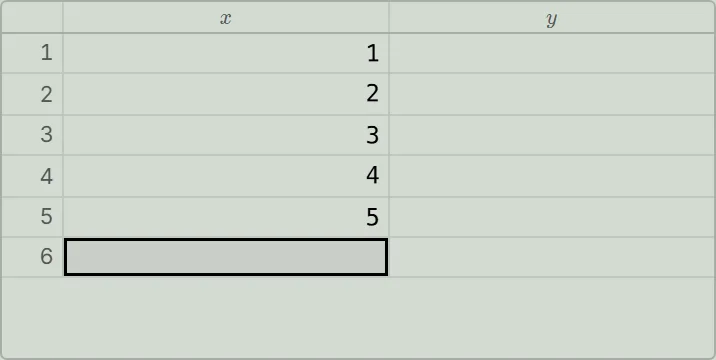
-
Step 3
Tap the first cell. Enter , pressing the equals key after each value. The empty cell in row 6 is selected when you finish.Press: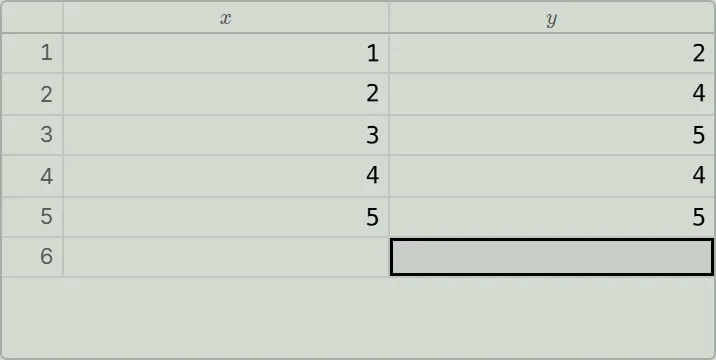
-
Step 4
Press the equals key on that empty cell, then tap Reg Results. Read the block: , , and . Check that it is marked In use.Press:
-
Step 5
Tap the arrow at the top-left of the results list to return to the table. Press the equals key on the empty row, then tap Statistics Calc. Its header should show .Press: -
Step 6
Enter , then open Statistics variables with the keys shown. It opens at Regression; tap . Press the equals key: the input is and the answer is .Press: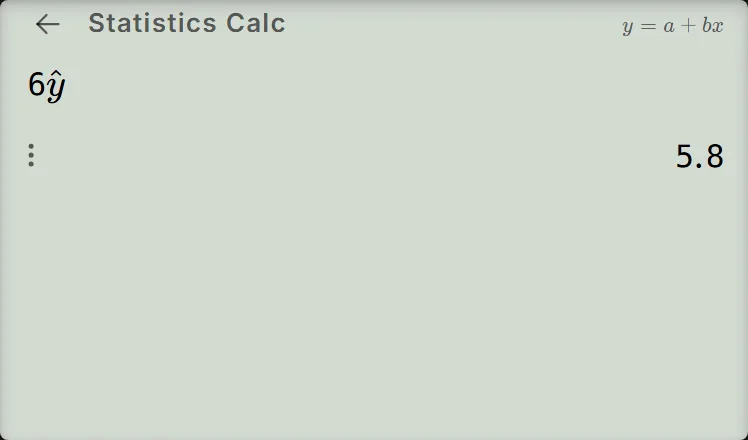
Read and check the result
In , is the intercept and is the slope. The fitted line is:
The same block shows the correlation coefficient . Check the prediction by substituting :
Here means the estimated for the typed before it. Enter it after the number: .
The line of best fit is the straight line , so keep it marked In use: that is the fit the prediction uses. The other six blocks are curves; Reg Results lists them for comparison and does not choose one for you.
Other ways to estimate y
Under the seven blocks of Reg Results, the Estimate buttons open Statistics Calc with that estimate already typed after an empty box: tap , enter in the box and press the equals key to get .
If your result is different
- Old numbers are still in the table: tap the trash button on the function bar under the screen, then confirm with Delete All. This removes the old data before you enter the example.
- A cell is still empty: enter every value. A row without a is left out of the fit, so the line changes.
- The wrong fit is selected: return to Reg Results and tap the block. Check the fit named in the Statistics Calc header before predicting.
- The results list covers the keys: use its top-left arrow to return to the table.
- A cell shows Syntax ERROR: press AC to clear the error.
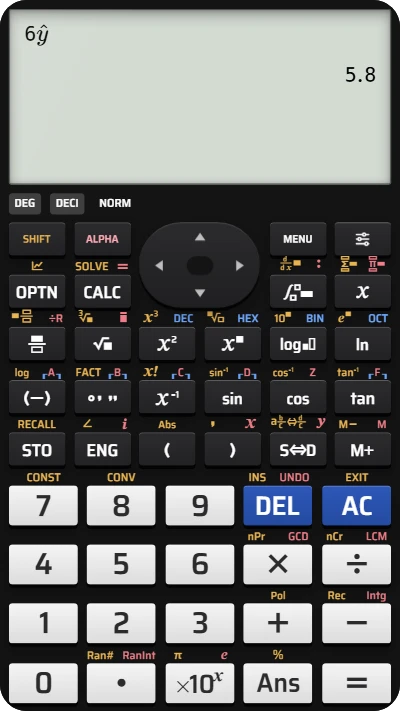
Find a line of best fit on your fx-991EX calculator
Enter the five pairs, find y = 2.2 + 0.6x, and use the line to predict y when x = 6.