Find the mean and standard deviation of a data set
Enter a list of numbers to find its mean, population standard deviation and sample standard deviation.
Artikel ini belum tersedia dalam bahasa Indonesia. Versi lengkap bahasa Inggris ditampilkan.
Need the average and standard deviation of a list of numbers? Enter the values in Statistics and read the results together. For this example, use:
The calculator gives both population and sample standard deviations, so you can read the one named in your question.
Enter the data and open the results
Below each step is the screen you should see after pressing.
Next to each step is the screen you should see after pressing.
-
Step 1
Open the mode menu and tap Statistics, then tap 1-Variable. The editor opens with an column. If old numbers are already there, clear them as described below before continuing.Press: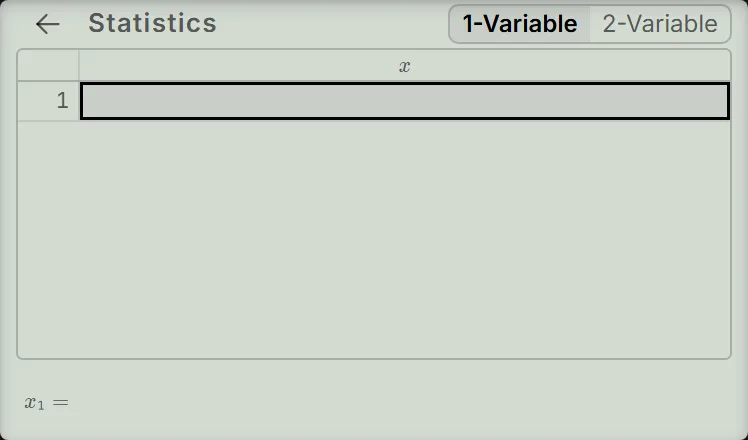
-
Step 2
Enter , , , and , pressing the equals key after each value. Each press moves to the next row; after , the empty sixth row is selected.Press: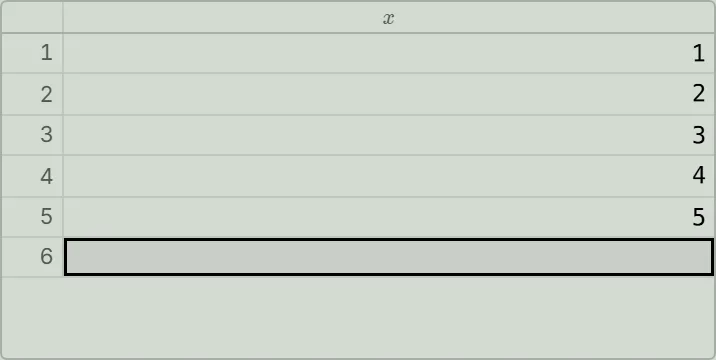
-
Step 3
Press the equals key on that empty row to open the Statistics sheet, then tap 1-Var Results. The results list shows the mean, both standard deviations and the number of values.Press: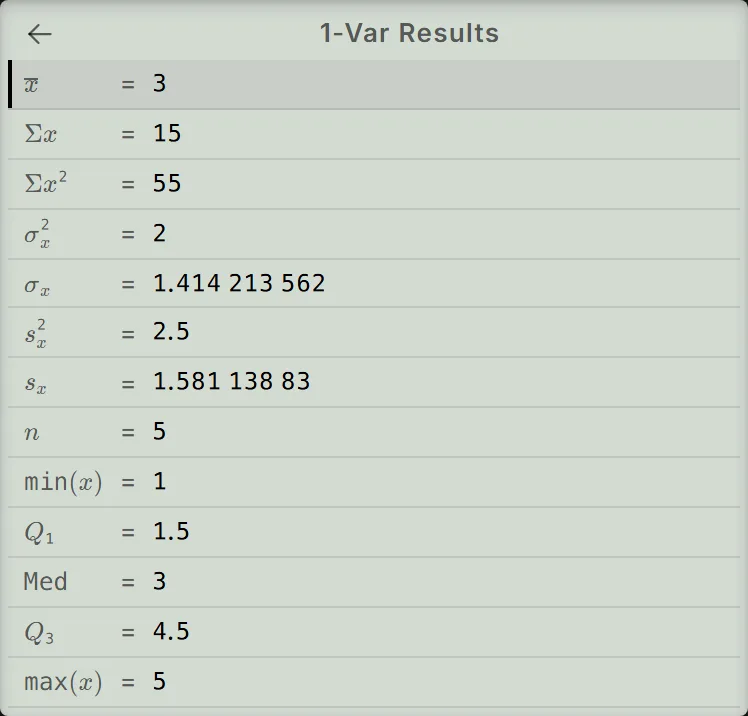
Read and check the results
For these five values, look for these rows:
| Row | Meaning | Displayed value |
|---|---|---|
| Mean | ||
| Population standard deviation | ||
| Sample standard deviation | ||
| Number of values |
Check the mean: . The squared differences from add up to . Population standard deviation divides this sum by before taking the square root; sample standard deviation divides by :
These give the decimals shown above. Use the row named in your question; the list supplies both.
Data with frequencies
When a value occurs several times, enter it once with its count. Start with an empty 1-Variable table (if the numbers to are still there, clear them first, as described in the last section) and enter the marks below in x, pressing the equals key after each. Tap Stat on the function bar under the screen → Frequency and turn it On (if it already reads On, leave it). This keeps the marks and adds Freq filled with ; tap its first cell and enter the counts below, pressing the equals key after each. Then press the equals key on the empty row and choose 1-Var Results.
| Mark (x) | Count (Freq) |
|---|---|
| 5 | 2 |
| 6 | 3 |
| 7 | 4 |
| 8 | 1 |
The results list shows , (population) and (sample). Here is a count, so is the sum of the counts. Check by hand: and , giving , and .
If the data or result is wrong
- Old numbers are still in the table: data remains when you leave or reload. Tap the trash button on the function bar under the screen, then confirm with the red Delete All button. The dialog warns that this cannot be undone; Cancel keeps the data.
- A number needs correcting: use the top-left arrow on the results list to return to the editor. Tap the wrong cell, type the correct number and press the equals key.
- A cell shows Syntax ERROR: a typo such as
1.5.5leaves the text in the cell. Press AC to dismiss the error, then correct the entry.
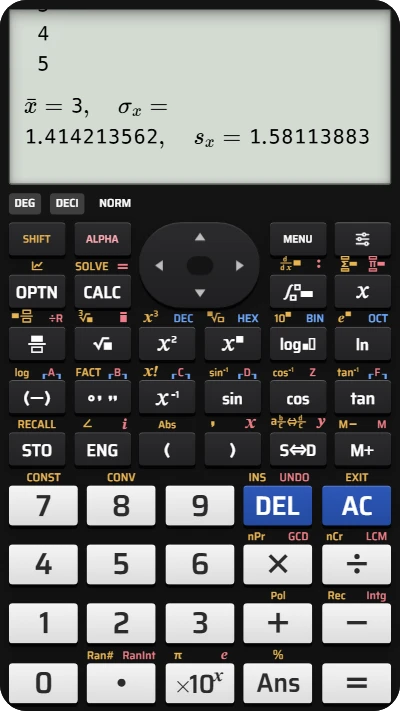
Find mean and standard deviation on your fx-991EX calculator
Enter 1, 2, 3, 4 and 5, then compare the mean and the two standard deviations in the results list.