Example
Example: y=x3−4x+1
-
Enter function x3−4x+1, and then press
GRAPH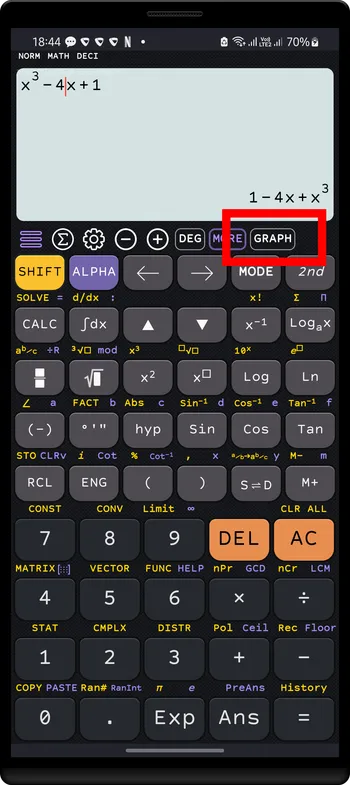
-
Tap the Graph button to draw graphs:
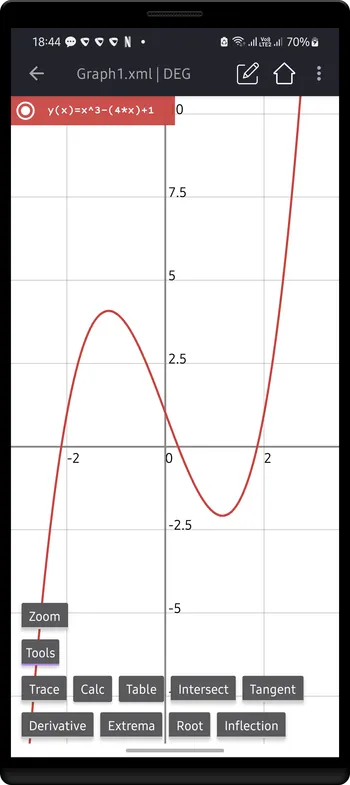
CalcES are fully supported function graph in Cartesian coordinates.
y=f(x)Example
Example: y=x3−4x+1
Enter function x3−4x+1, and then press GRAPH

Tap the Graph button to draw graphs:

Using the Tracing option to view value graph at a point
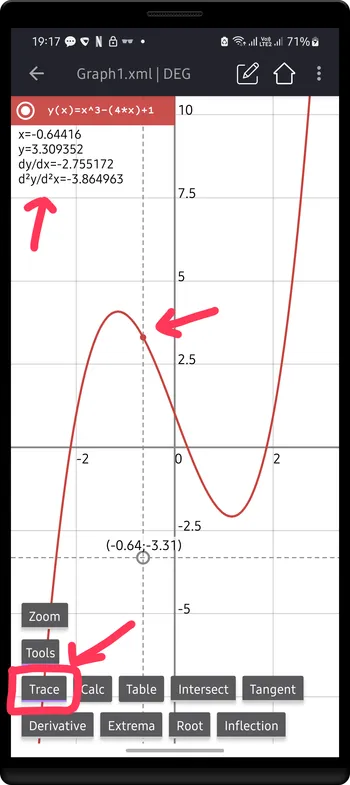
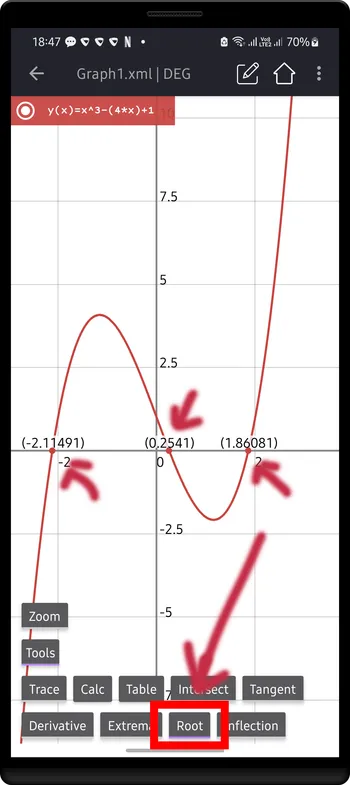
Enable Root option, all roots will show
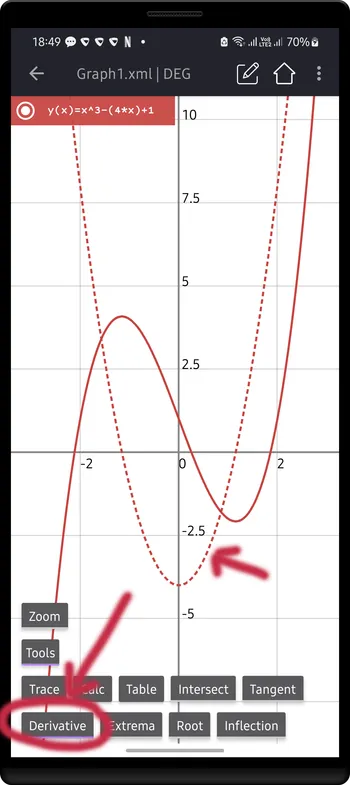
Enable Derivative option, a dash line represents the derivative of function will show
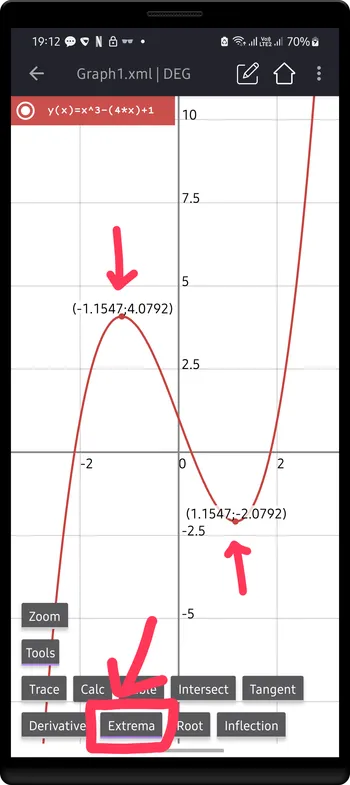
Enable Extrema option, all local/global maximum/minimum points will show
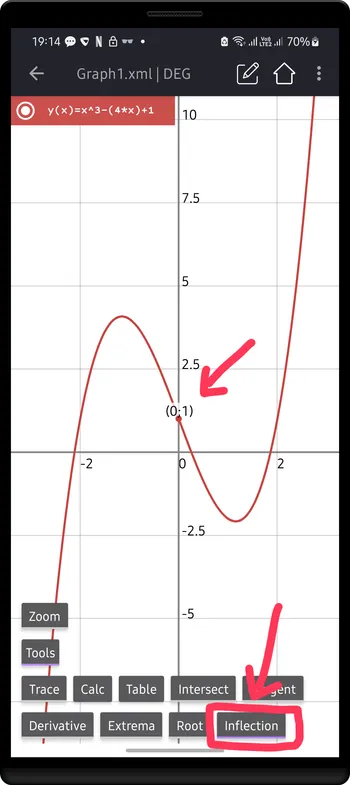
Enable Inflection option, all inflection points will show
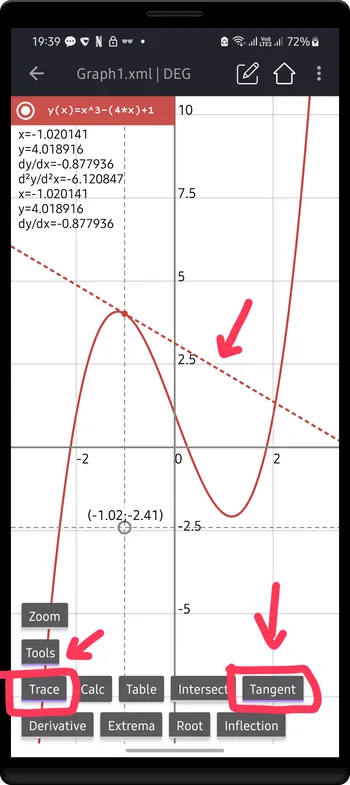
Using Trace and Tangent options to show tangent line at a specific point
Entering more than 1 functions to show intersection points between them.
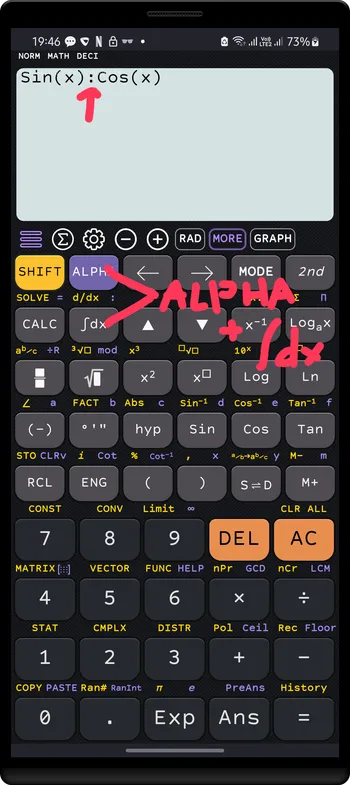
Using : to enter multiple Cartesian functions:
y(x):g(x):h(x)Example
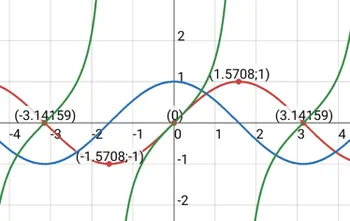
Example, enter Sin(x):Cos(x):
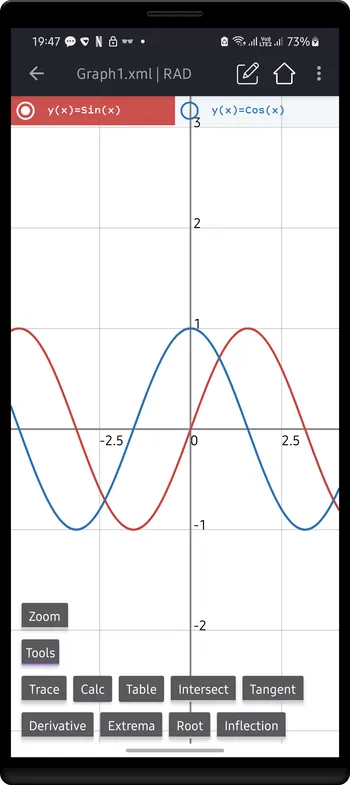
Press GRAPH button to draw multiple graphs:
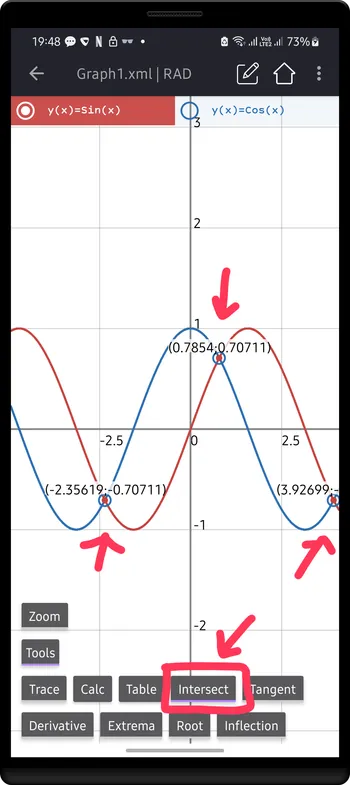
Enable Intersection option, all intersection points between the selected function and others will show
Other examples
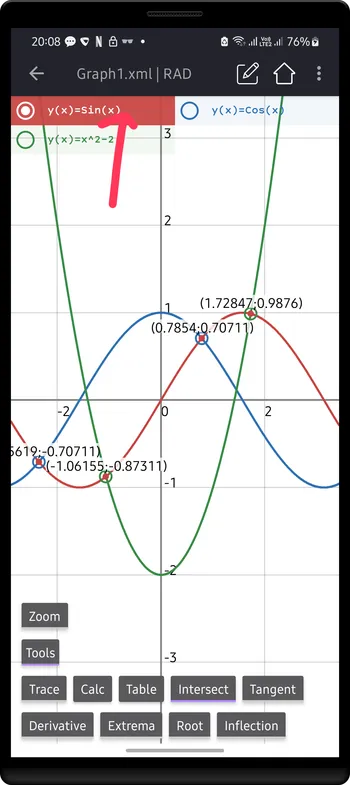
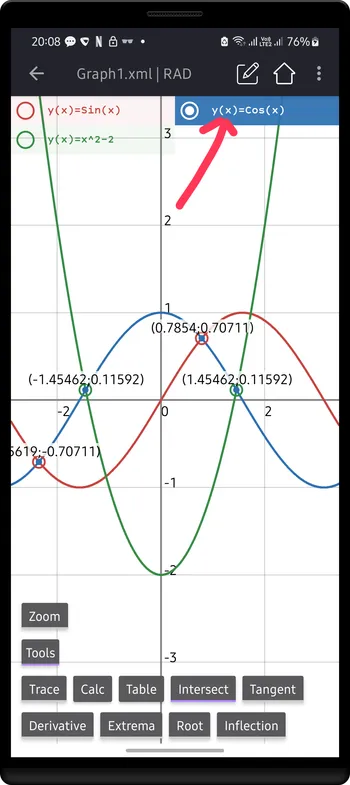
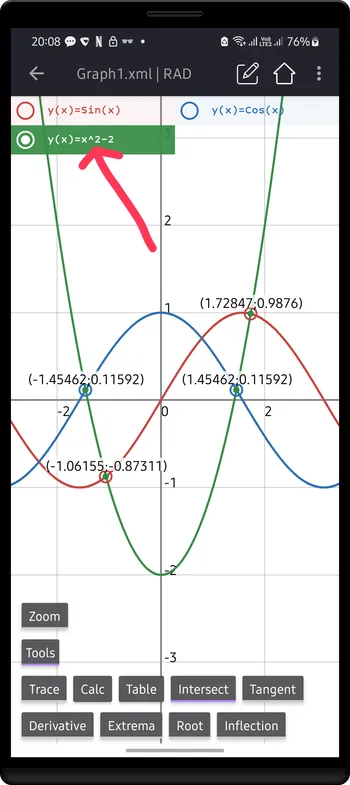
The Calc panel allow to you calculate with selected function
Tab Calc to open CALC panel:
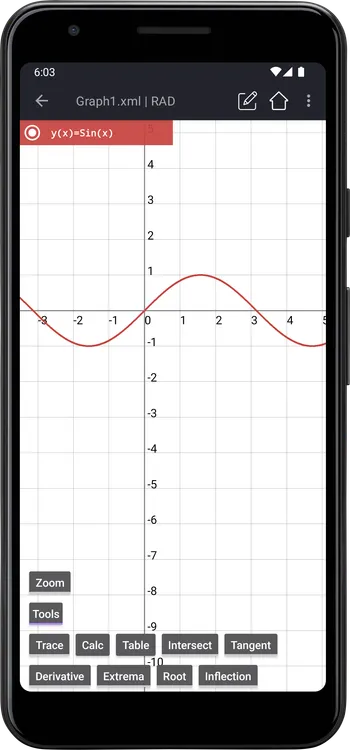
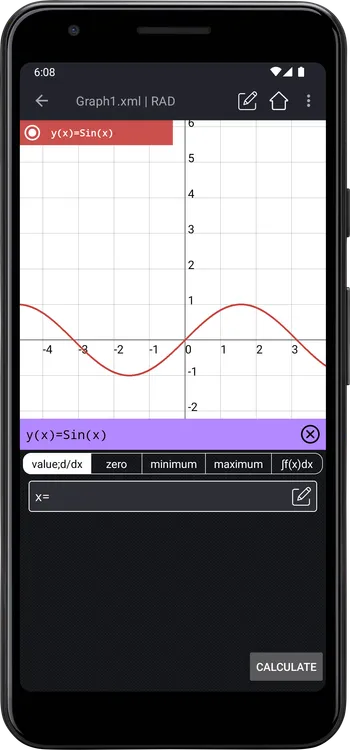
Properties of graph at x=2.1
x=2.1y=0.863209367dy/dx=-0.504846105d^2y/d^2x=-0.863209367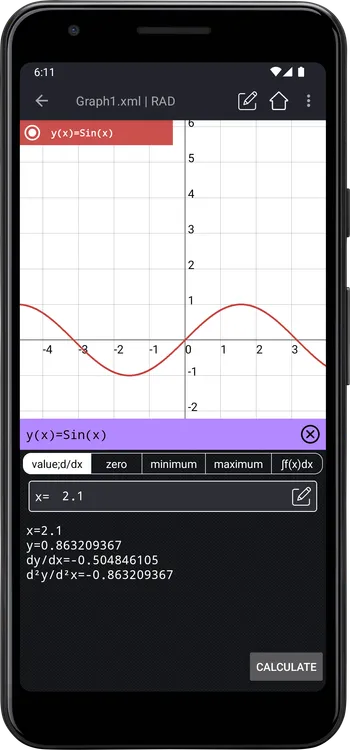
First root of Sin(x) from -2 to -1
x=12.566370614y=-0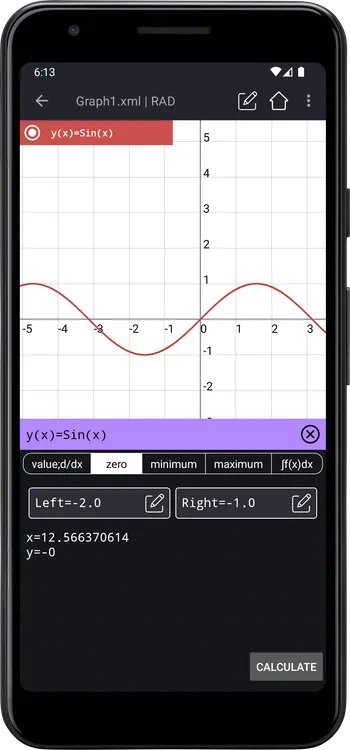
Minimum value of Sin(x) from -2 to -1
xMin=-1.570796153yMin=-1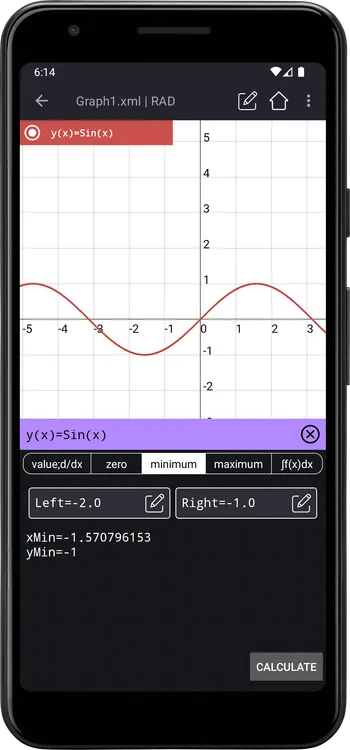
Maximum value of Sin(x) from -2 to -1
xMax=-1.000000435yMax=-0.84147122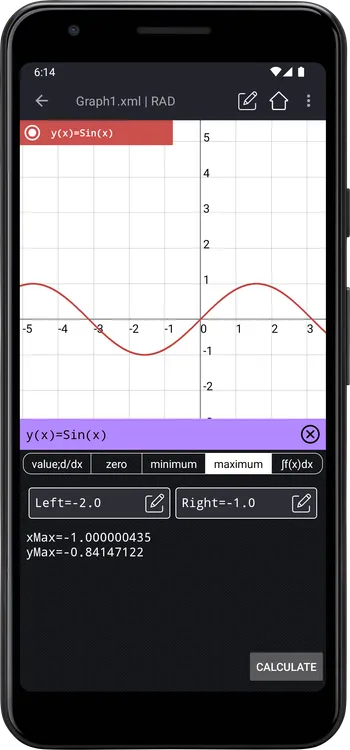
For integral tab, the graph will display additional shading in given range. Integral of Sin(x) from -2 to 3.
=0.57384566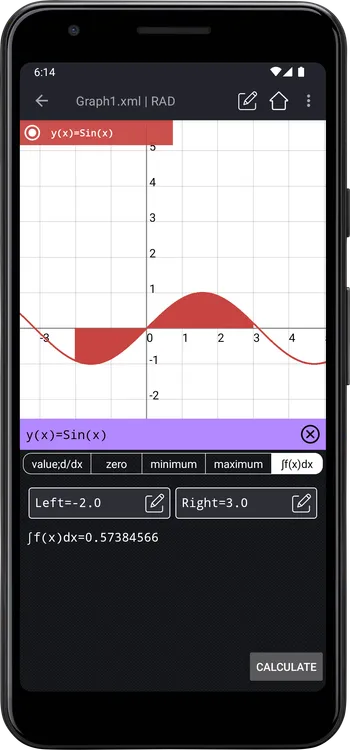
The Table panel allow you to generate a table of values. Tap the Table button to open it:

Here is the table of values of y=Sin(x) with Δt=1, and start at 0
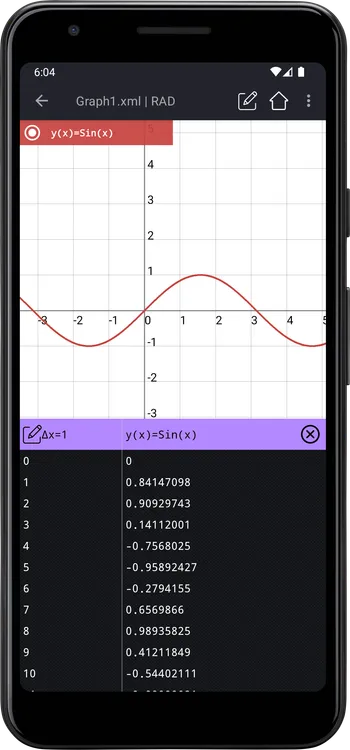
To change the Δt or the Start value, tap the edit icon on the left of Δt:

Tap the edit icon to change value of Start and Step:
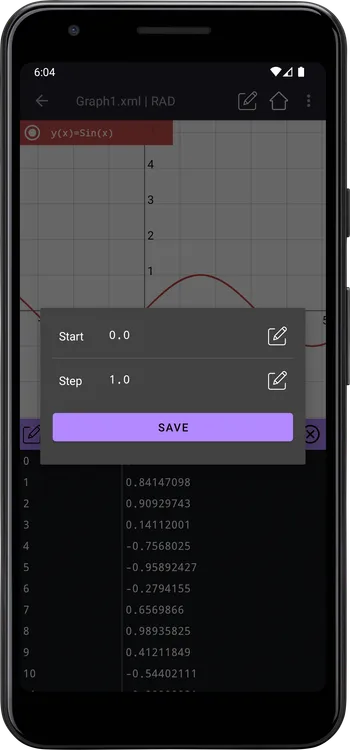
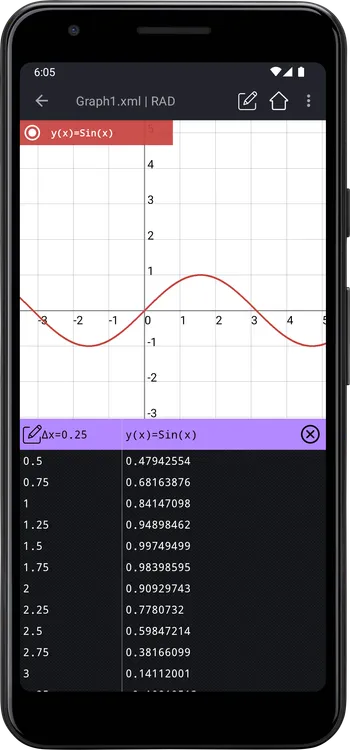
Example, Start=0.5 and Step=0.25
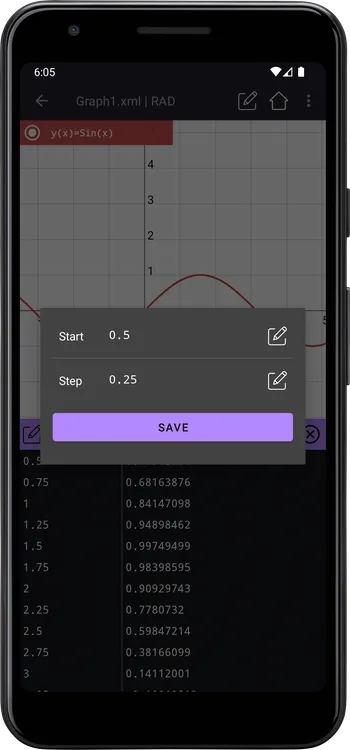
Tap Save to recalculate the table of Sin(x):
Updated at Thu 21 Dec 2023