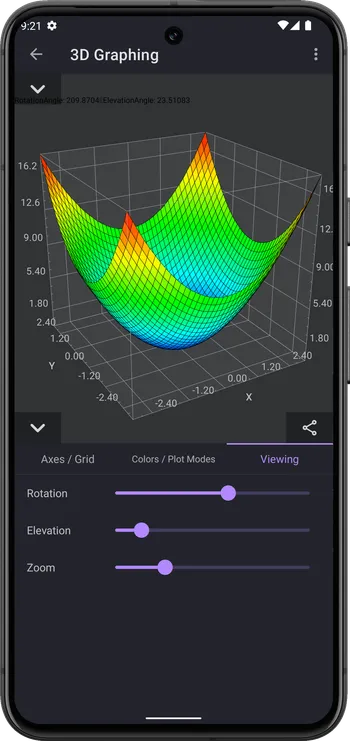
This function represents the sum of sine functions of x and y.

In this manual, we’ll explore how to visualize mathematical functions in three dimensions. We’ll cover the basics of coordinate systems and show you how to create, manipulate, and interpret 3D graphs of functions.
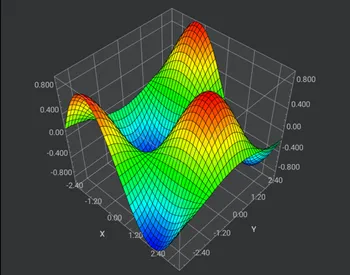
The CalcES calculator accepts f(x,y) as 3D function.
This function represents the sum of sine functions of x and y.

This function is the product of x and the sine of y.

This function represents a linear plane in three-dimensional space with a slope of 2 in both the x and y directions and an intercept of -3.

To enter the 3D graphing mode on CalcES calculator, follow these steps:
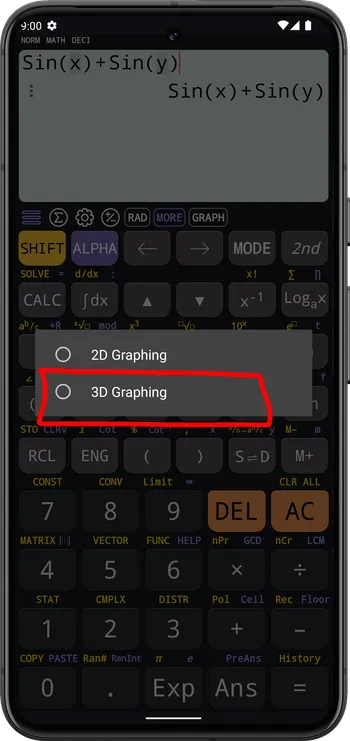
Input the f(x,y) function: sin(x)+sin(y):
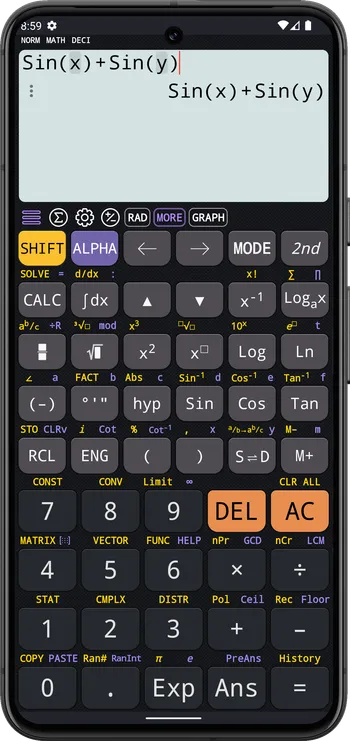
Tap the GRAPH button to show graph options dialog
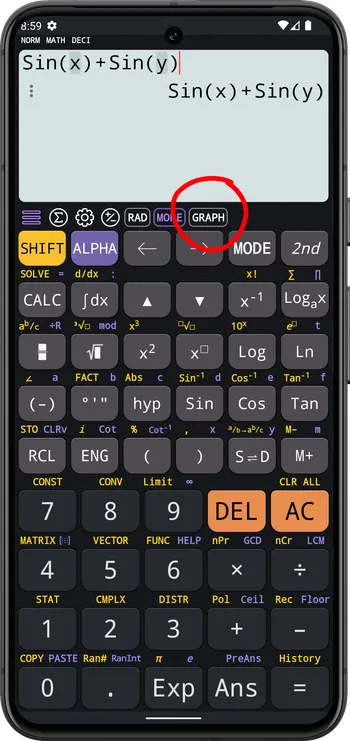
Select the 3D Graphing option to open 3D graphing screen
The 3D Graphing screen is displayed
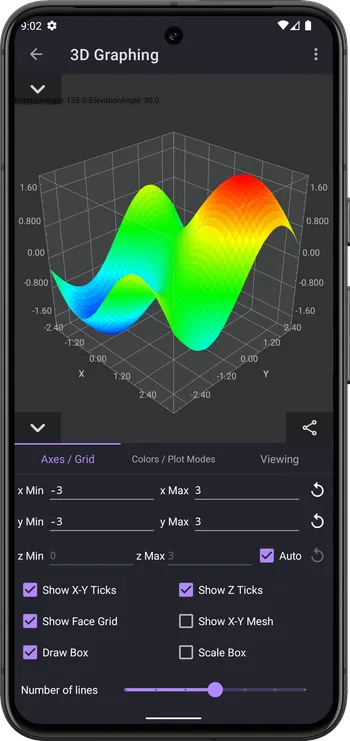
Adjusting viewing parameters allows you to manipulate the perspective and orientation of the graph, providing a clearer understanding of the plotted functions. Here’s how you can adjust viewing parameters on CalcES calculator:
Control the zoom level to change the scale of the graph. Zooming in brings objects closer and magnifies details, while zooming out provides a broader view of the graph. Use the zoom-in and zoom-out functions to adjust the magnification as needed.
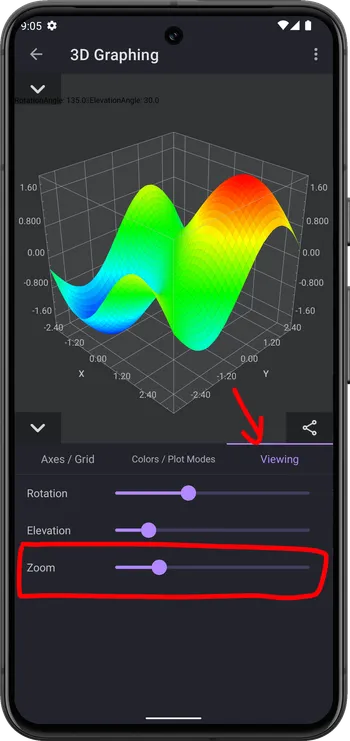
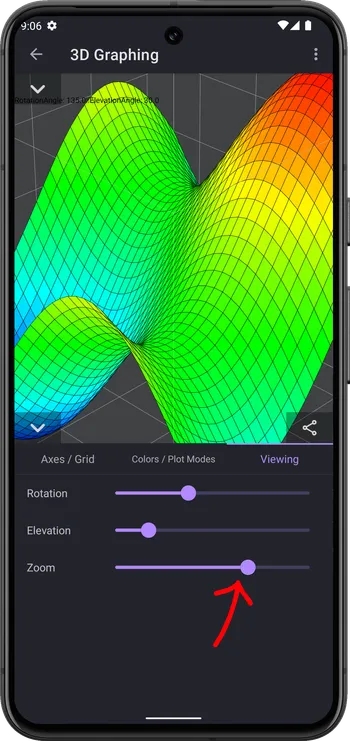
Rotate the graph to view it from different angles. Rotating the graph allows you to explore its structure from various perspectives, helping you gain insights into its shape and behavior. Use the rotation controls to rotate the graph horizontally, vertically, or around its axis.
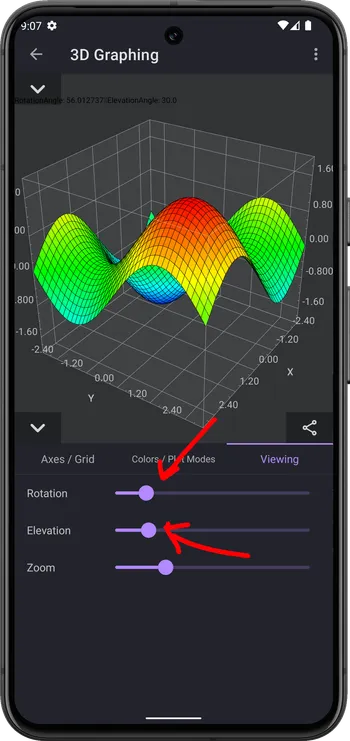
In 3D graphing, color and style options play a crucial role in enhancing the visual clarity and aesthetic appeal of plotted functions. Here’s how you can utilize color and style options on CalcES calculator to customize the appearance of your graphs:
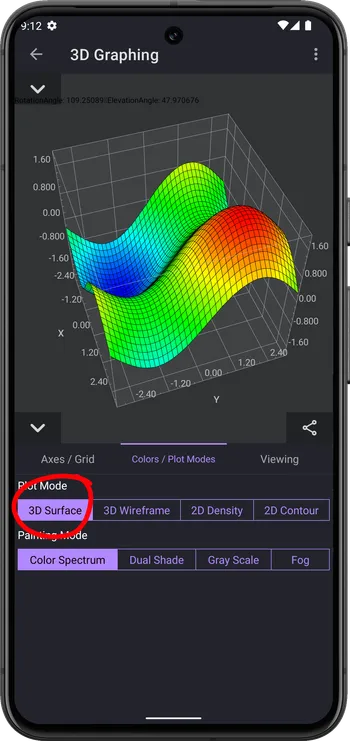
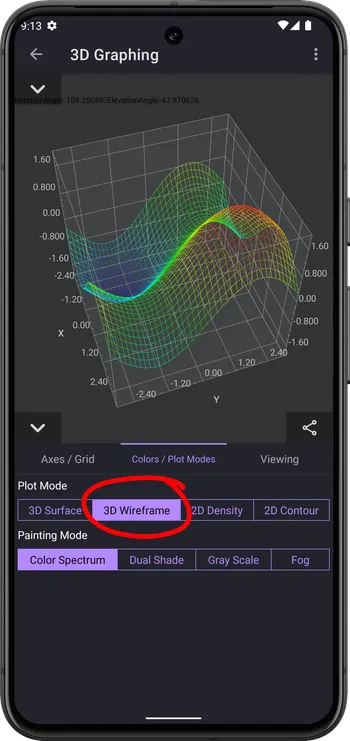
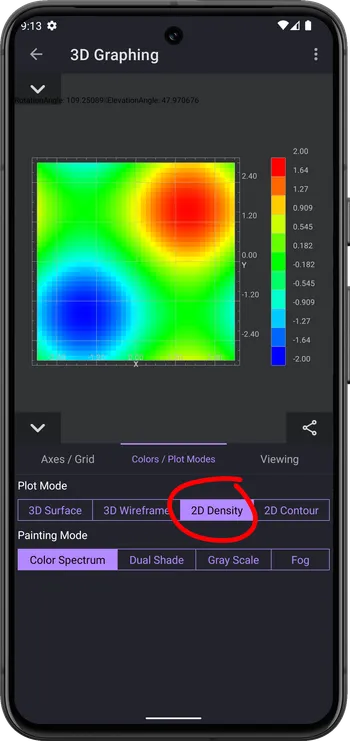
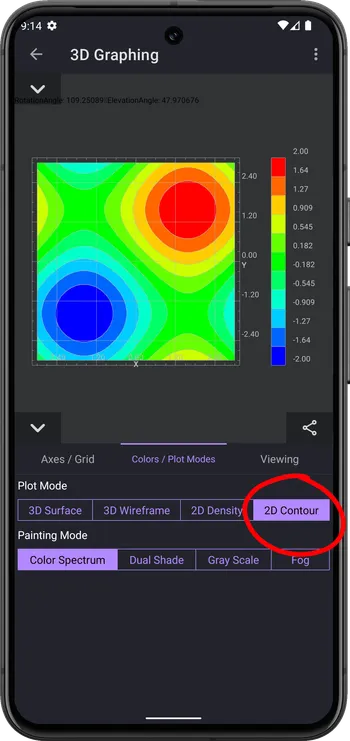
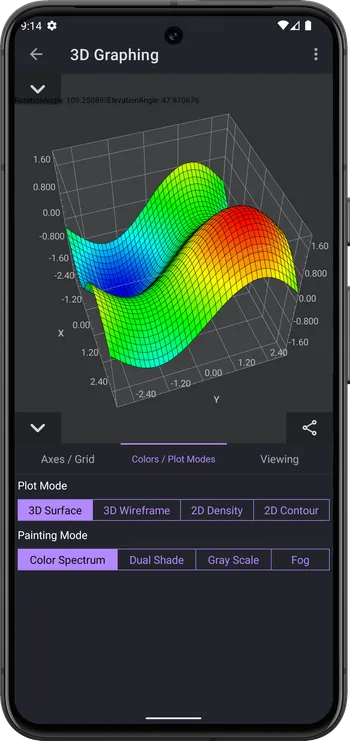
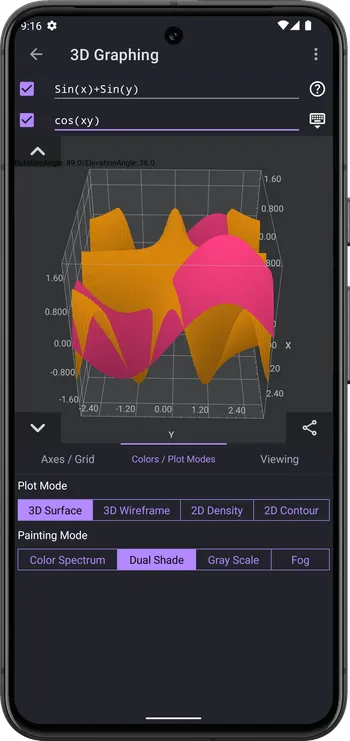
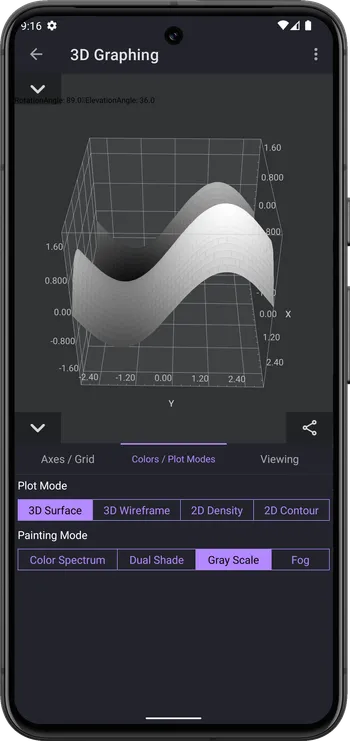
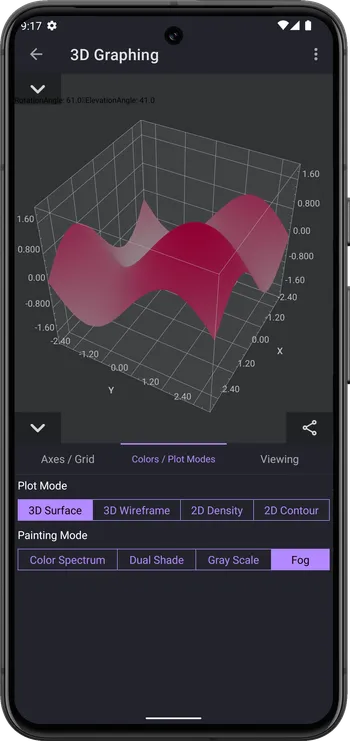
These color modes offer different aesthetic styles and visualizations, allowing users to choose the most suitable color representation based on their preferences and requirements.
By leveraging color and style options effectively, you can create visually appealing and informative 3D graphs that effectively convey the underlying mathematical concepts. Experiment with different combinations to find the optimal settings that suit your preferences and facilitate a deeper understanding of plotted functions.
Example Problems
Plot the function x2+y2 in the 3D graphing mode of CalcES calculator.
GRAPH to show graph options dialog