Try CalcES Scientific Calculator Online
Example
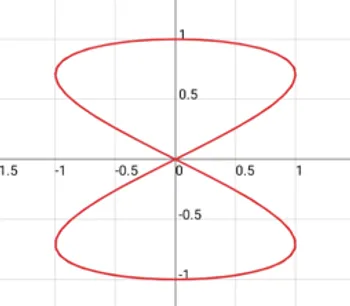
x=Sin(2t)
y=Cos(t)
y=Cos(t)
CalcES supports draw parametric function with x and y parameters.
Example
Syntax:
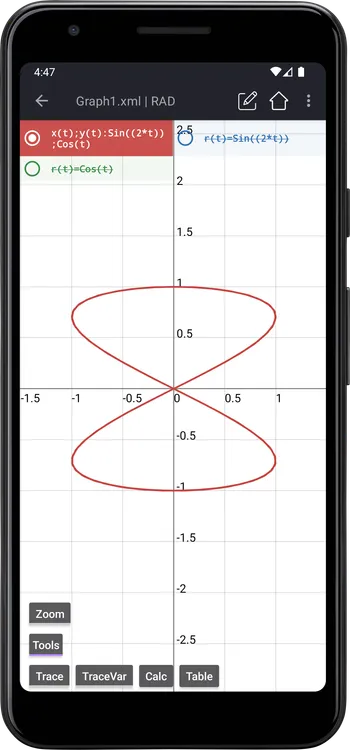
x(t):y(t)
Tap the GRAPH button to draw parametric graph
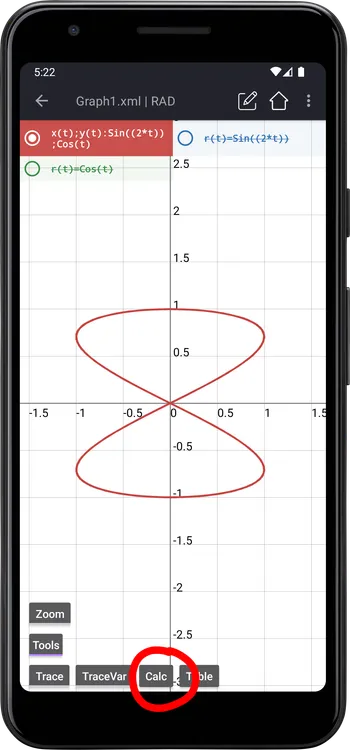
CALC panel: calculate value a pointThe Calc panel allow you to calculate the value of x(t):y(t) with given t value.
Press Calc button to open Calc panel:
Tap the Edit icon to enter the value of t
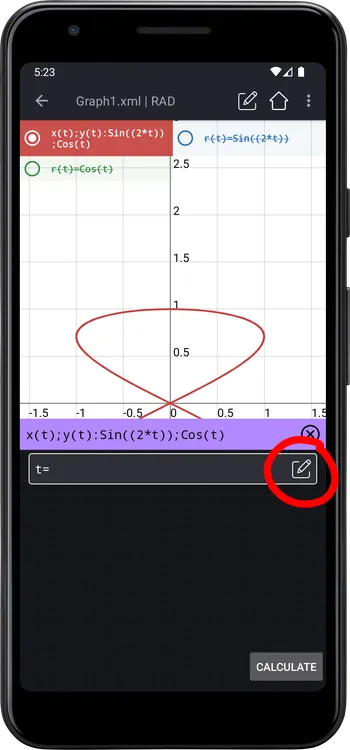
After entering value of t , the panel displays some properties at t :
x = ?y = ?dx/dt = ?dy/dt = ?dy/dx = ?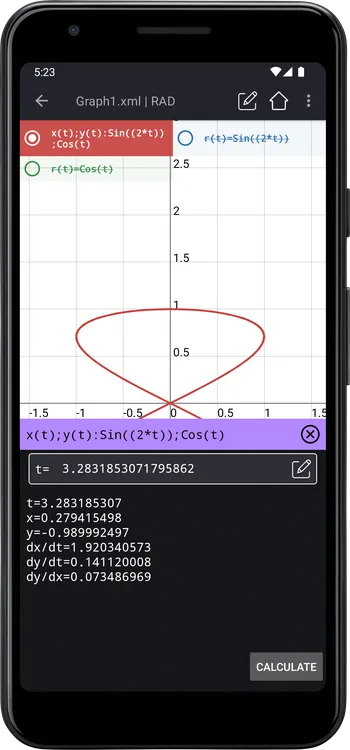
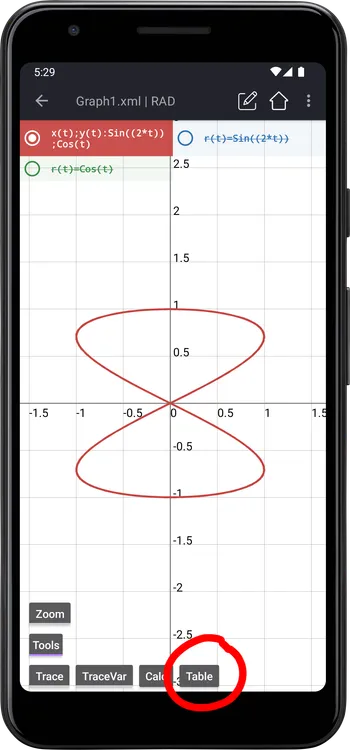
TABLE panel: generate table of valuesThe Table panel allow you to generate a table of values.
Tap the Table button to open it:
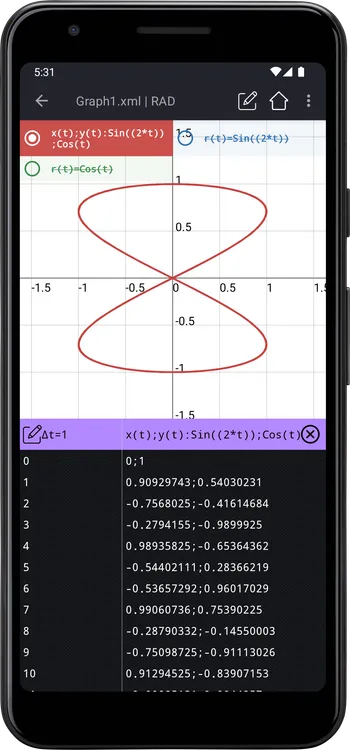
Here is the table of values of Sin(2t):Cos(t) with Δt=1 , and start at 0
To change the Δt or the Start value, tap the edit icon on the left of Δt :
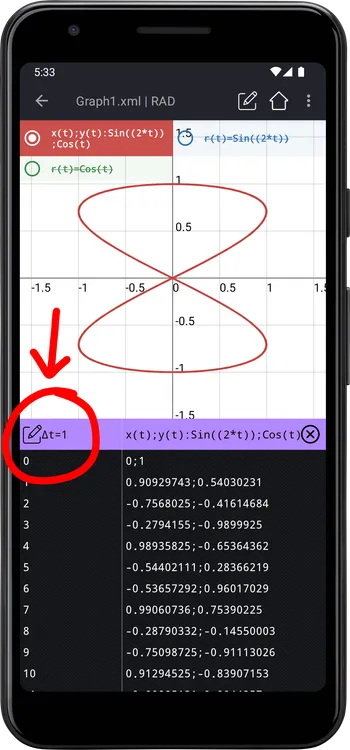
Tap the edit icon to change value of Start and Step:
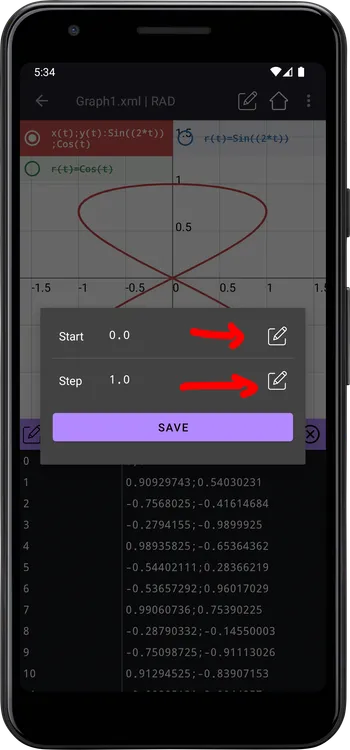
Example
Example, Start=0.5 and Step=0.25

Tap Save to recalculate the table:

t rangeThe default range of t variable is from -10 to 10, to change this value:
Open the settings screen:

Select the Graph tab

Scroll to the Parametric graph section:

Change the Parametric start and Parametric stop with your value, tap OK to save

Example
Example:
0 to π