Try CalcES Scientific Calculator Online
Example
Example: 1−2Sin(t)
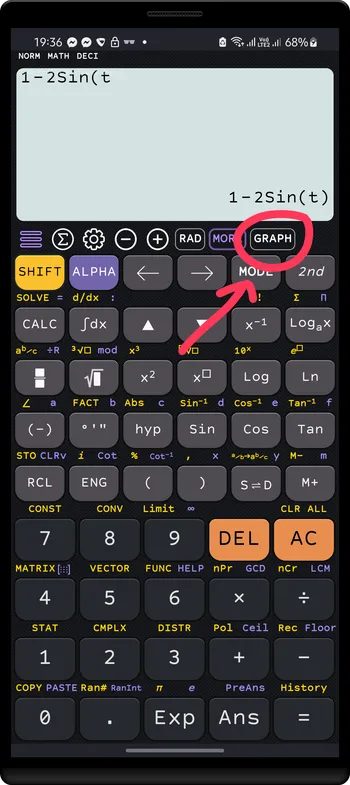
CalcES supports multiple types of graphs, including Polar graphing. For example, you can graph a sine function in polar coordinates using the syntax Sin(t), where t is the angle.
Entering expression with t variable will treat as polar function.
Example
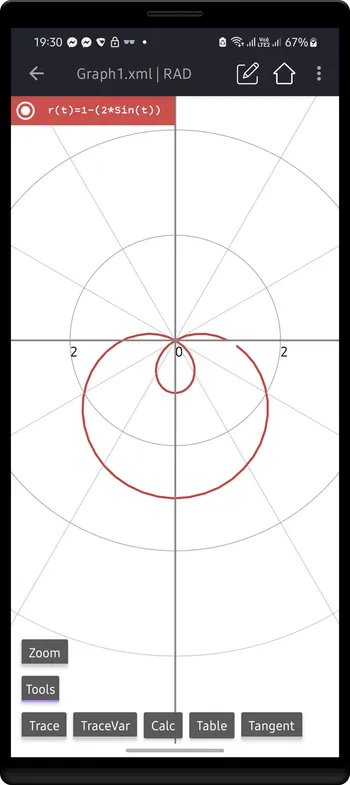
Example: 1−2Sin(t)
Remember change the angular unit to RAD
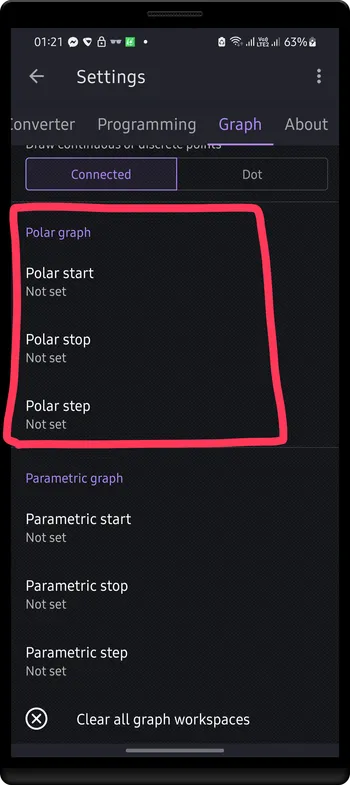
Enable “Polar coordinate” option in Settings to draw graphs on Polar coordinate

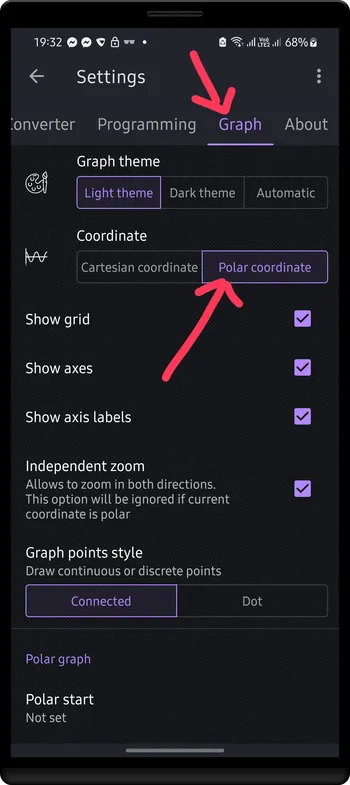
Set the polar start, stop and steps if needed. The default values is start=0, stop=2Pi, step=0.1
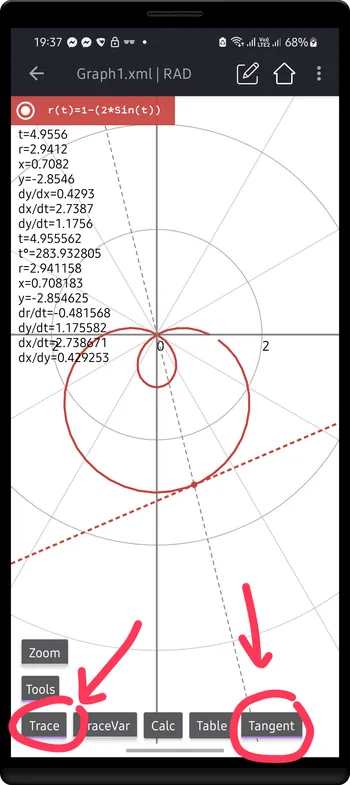
Enable Tangent and Trace options to display tangent of polar graph at a specific point
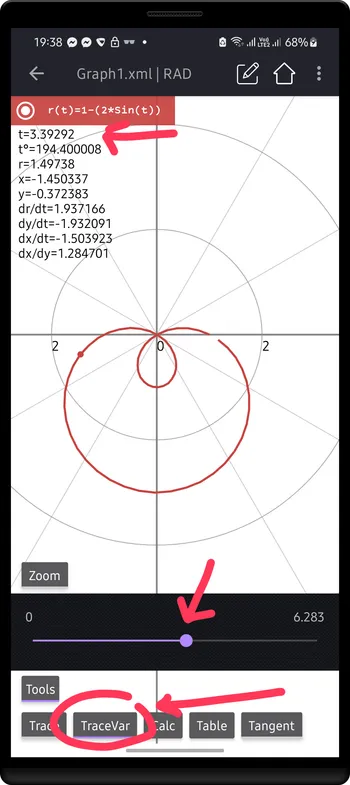
Enable TraceVar option to display a slider, use this slider to change the value of the t variable
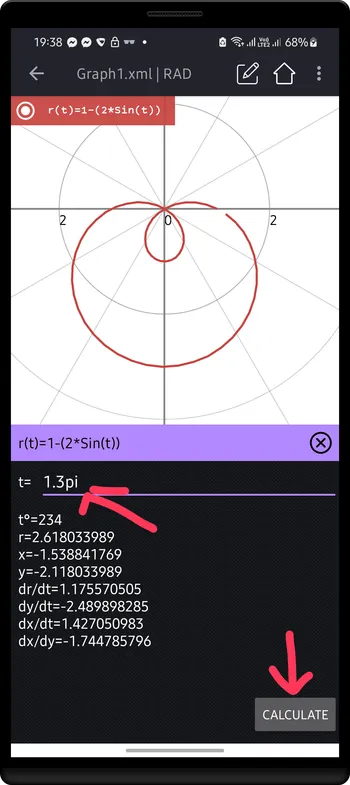
Tap Calc button to show the calculation panel
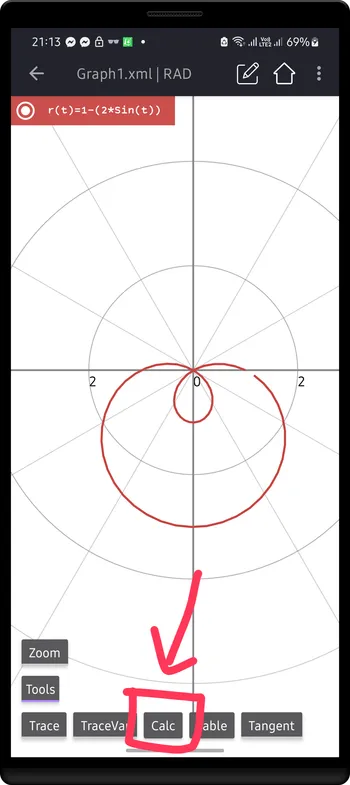
Enter the value of t in the t= field, and then tap Calculate to calculate graph properties.
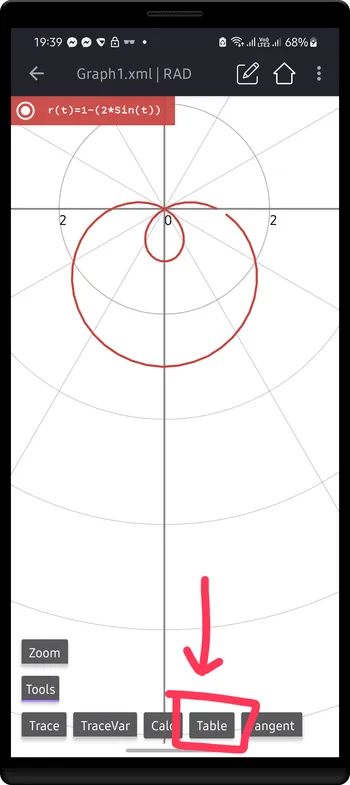
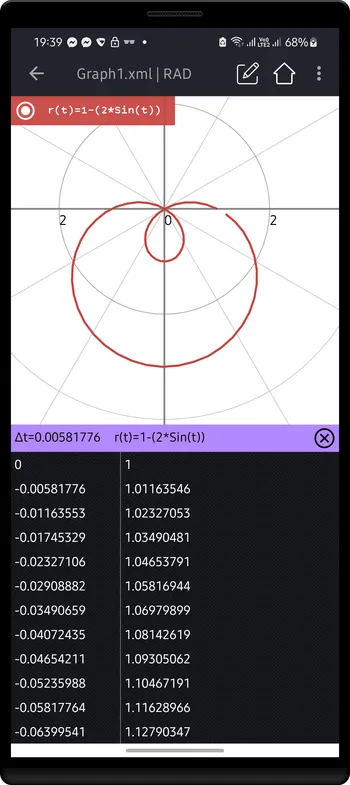
Tap Table button to show the table panel, it displays the table of values.
The left column is t values, and the right colum is r(t) values
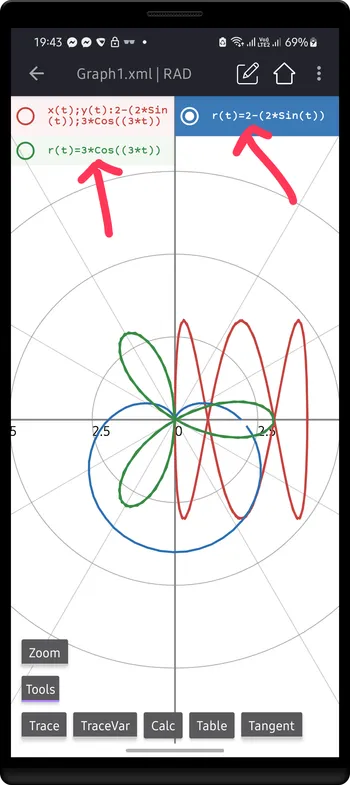
Using : to separate between graphs.
Example
Example: 2−2Sin(t):3Cos(3t)
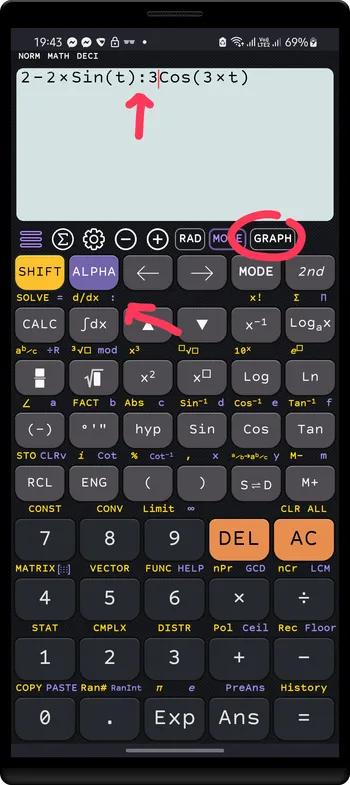
Tap GRAPH to draw graphs.